DESIGN
Open to Opportunities

Closing learning gaps through data & pedagogy — not guesswork.

I diagnose root-cause cognitive bottlenecks, analyze student assessment data, and engineer structured 1-on-1 and small-group remediation plans that guide K–12 learners toward 90%+ concept mastery.

4+
Years in Education
10+
Courses Designed
350+
Learners Impacted
AR
Ruth Ayogu
Learning Specialist & Academic Interventionist
EdTech Learning Analytics K-12 Support
✦ Available for
Remote Roles
Who I Am

Educator. Interventionist. Data lead.

I'm a learning Specialist and Academic Interventionistwho believes most academic breakdowns aren't a lack of student ability—they are unaddressed cognitive bottlenecks that standard classrooms rarely catch in time. With a background spanning classroom instruction, multi-disciplinary primary leadership, and digital tool integration, I've spent years figuring out how to make learning actually work.

My approach sits at the intersection of learner analytics, diagnostic remediation, structured study architecture, learner psychology, and practical technology.

I'm currently targeting roles in Academic Intervention, Learning Support Strategy, and K–12 Educational Consulting across innovative schools, EdTech platforms, and forward-thinking learning organizations where I can bring both pedagogical rigour and creative problem-solving to teams building the future of learning.

Diagnostic Gap Analysis

Uncovering root-cause learning hurdles using formative assessments and behavioral data.

Tiered Remedial Design

Structuring multi-tier intervention pathways that support struggling students and challenge high flyers.

Digital Tool Fluency

Comfortable navigating EdTech platforms, LMS systems, and remote workflows.

Learning Analytics

Transforming complex multi-term assessment records into actionable progress dashboards.

Featured Work

Projects that Solved Real Problems

Each case study demonstrates an identified learning bottleneck, a data-driven model, and measurable learner recovery.
70% MUSIC LIT RS MATH ENG DICT FR IGBO
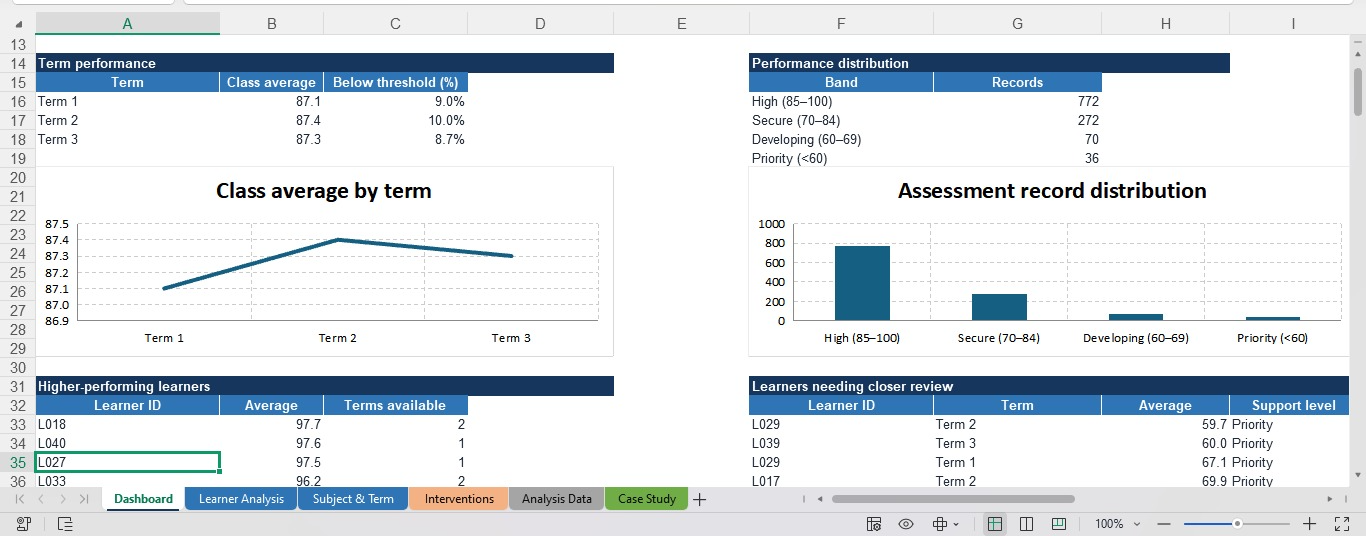
learner-performance Analysis project visual
Project 01 · Data Analysis & Learning Analytics

Learner Performance Analysis & Intervention Dashboard

Problem
Raw assessment scores were stored across three separate term sheets with no way to identify recurring learning gaps, compare cohort trends, or flag learners needing targeted support.
Solution
Built a multi-term Excel dashboard that transforms 1,150 subject-score records across 46 learners and 17 subjects into clear performance insights, support tiers, and actionable intervention recommendations.
Outcome
↑ Cohort avg 87.3% · 9 priority learner-terms flagged · IGBO identified as recurring class-wide gap · 4-tier intervention plan produced
Microsoft Excel Data Cleaning Data Visualisation Learning Analytics 4-Tier Support Model
⚡
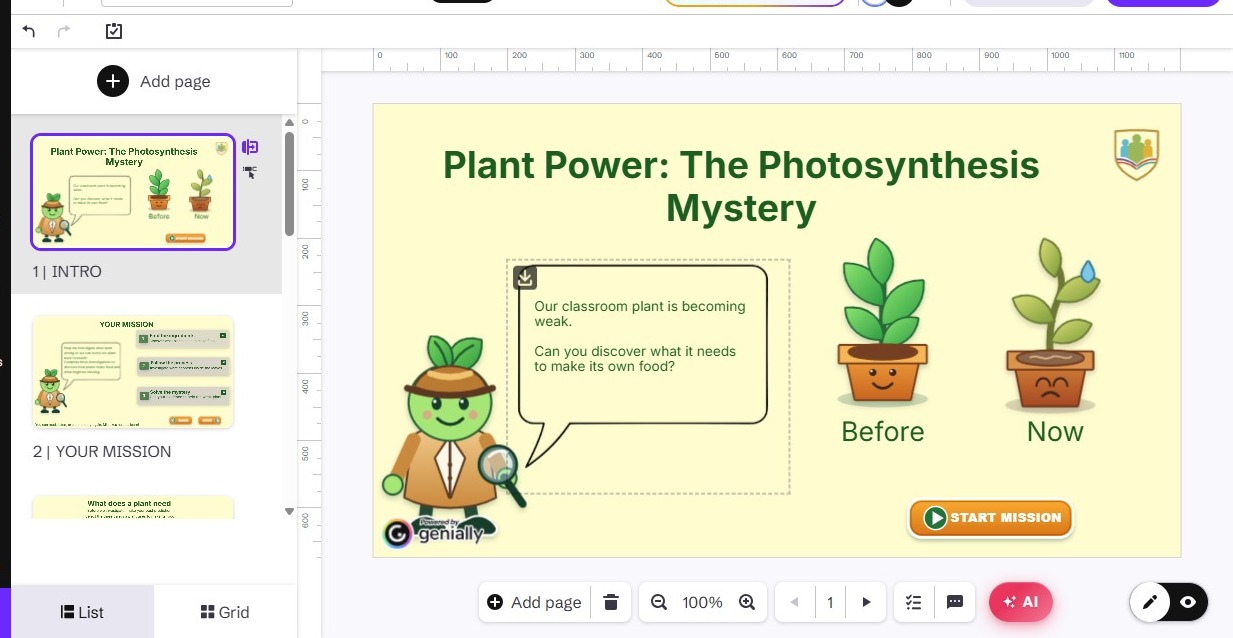
genially project visual
Project 02 . eLearning Development. Ages 8-9

Plant Power: The Photosynthesis Mystery

Problem
Photosynthesis is one of the most commonly misunderstood science topics for young learners. The process is invisible and abstract — static diagrams and textbook explanations don't create the discovery moment that makes content stick for 8–9 year olds.
Solution
Designed a mystery-narrative digital lesson in Genially where learners uncover how plants make food step by step. Animations, clickable interactions, and embedded questions keep learners actively involved rather than passively reading — turning a passive topic into an experience they want to explore.
Outcome
✦ Fully self-paced · Works in class or at home · Age-appropriate interactions designed for independent navigation by 8–9 year olds
Genially Instructional Design eLearning Development Visual Storytelling Primary Education
Preview Lesson ↗
Capabilities

What I Bring to the Table

🧩
Diagnostic and Remediation
Academic Intervention Diagnostic Assessment Multi-Tiered Support (MTSS/RTI) Foundational Literacy & Numeracy Curriculum Differentiation Cognitive Scaffolding Individualized Learning Plans Mastery-Based Learning
🛠
Analytics and Tools
Microsoft Excel (Advanced Trackers) Google Sheets & Data Validation Learning Analytics & Dashboards Cohort Trend Analysis Genially & Interactive Media Quizlet & Digital Drill Platforms Google Classroom LMS Platforms
🤝
Support & Soft Skills
Virtual Assistance Project Coordination Written Communication Stakeholder Management Facilitation Research & Synthesis Feedback Integration Remote Collaboration
How I Work

The Diagnostic-Remedial Cycle

Every intervention follows a structured, evidence-based sequence designed to turn persistent struggle into measurable growth.

01
Diagnostic Intake
Analyze historical test data, evaluate continuous assessments, and pinpoint root-cause skill deficits.
02
Tier Allocation
Categorize learners into precise support tiers to establish optimal intervention intensity.
03
Scaffolded Delivery
Deliver targeted 1-on-1 or small-group instruction using interactive drills and cognitive scaffolds.
04
Develop Content
Writing, scripting, and building materials across formats — text, visual, audio, interactive.
05
Progress Monitoring
Conduct weekly progress checks, update data dashboards, and adapt instruction within 48 hours.
Let's Work Together

Got a learning challenge? Let's solve it.

Send a Message